Blog
Project BioPharm.Si is all about the data: technologies for data collection, processing, mining, understanding, and data-driven decision making. Within the project, University of Ljubljana is adapting its flagship data mining software called Orange for mining process and molecular genetics data. The primary advantage of Orange compared to other data mining tools is its interactive visualizations.
Interactive data visualizations enable direct actions on a plot to change visualized graphical elements and link between multiple plots. Orange supports subset selection and labeling of data instances and linking of visualizations and data analysis procedures through the design of a workflow.
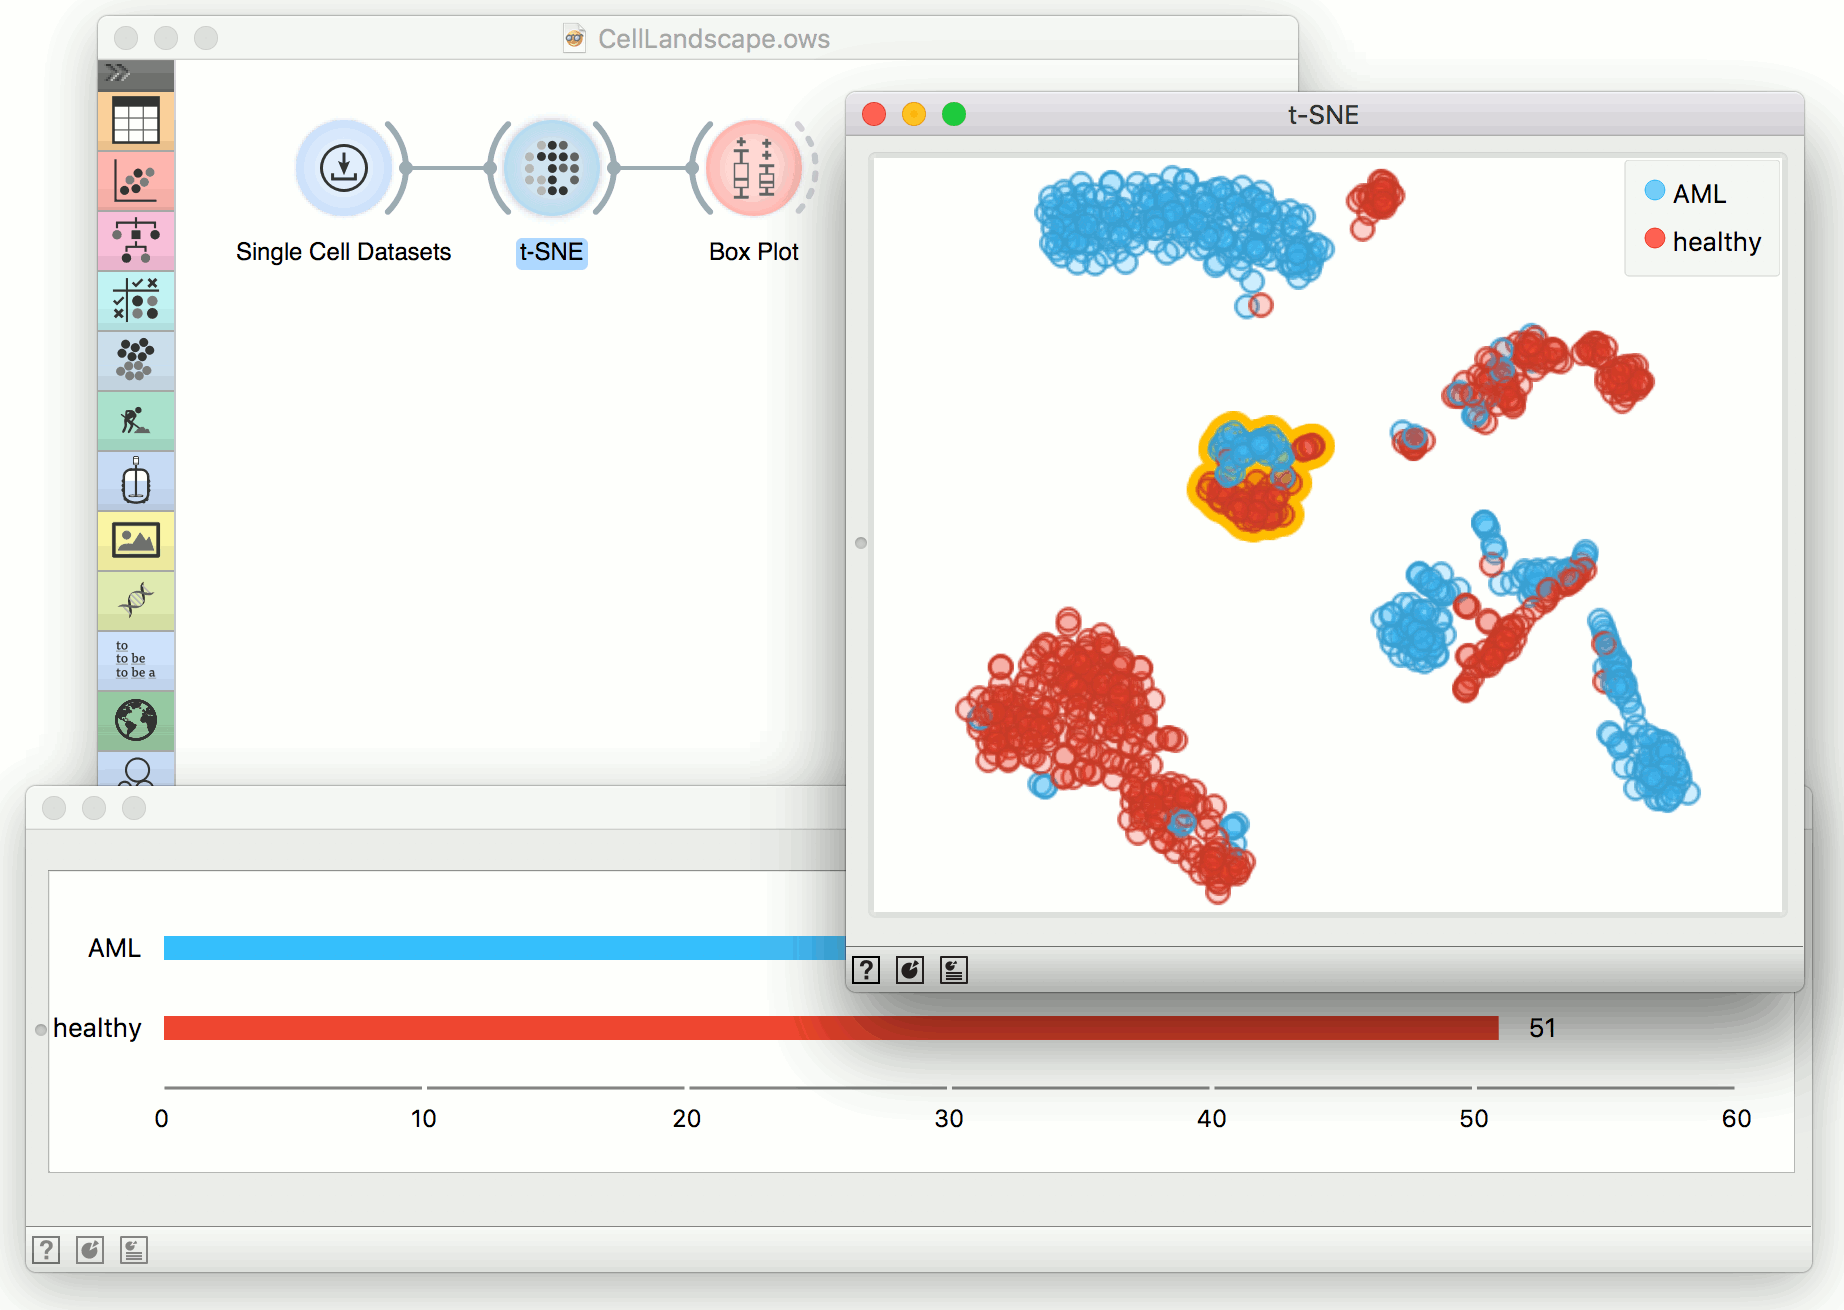
Here is a simple example. We will use single-cell genomics data on bone marrow mononuclear cells from a patient with acute myeloid leukemia (AML) and two healthy donors. Our data includes 1000 cells and 1000 genes with the highest dispersion, and we have downloaded it from 10x Genomics data repository. We read the data using Orange's Single Cell Datasets widget and project it on a two-dimensional plane using t-SNE. The visualization nicely separates cells of different types, where either AML or control cells prevail. To find the actual class distribution within each cluster, we select the group of cells in the t-SNE plot (points with yellow boundary) and feed the output to a box plot. Any change in t-SNE then automatically refreshes a box plot. We have just created a simple cell group browser for single-cell genomics data!
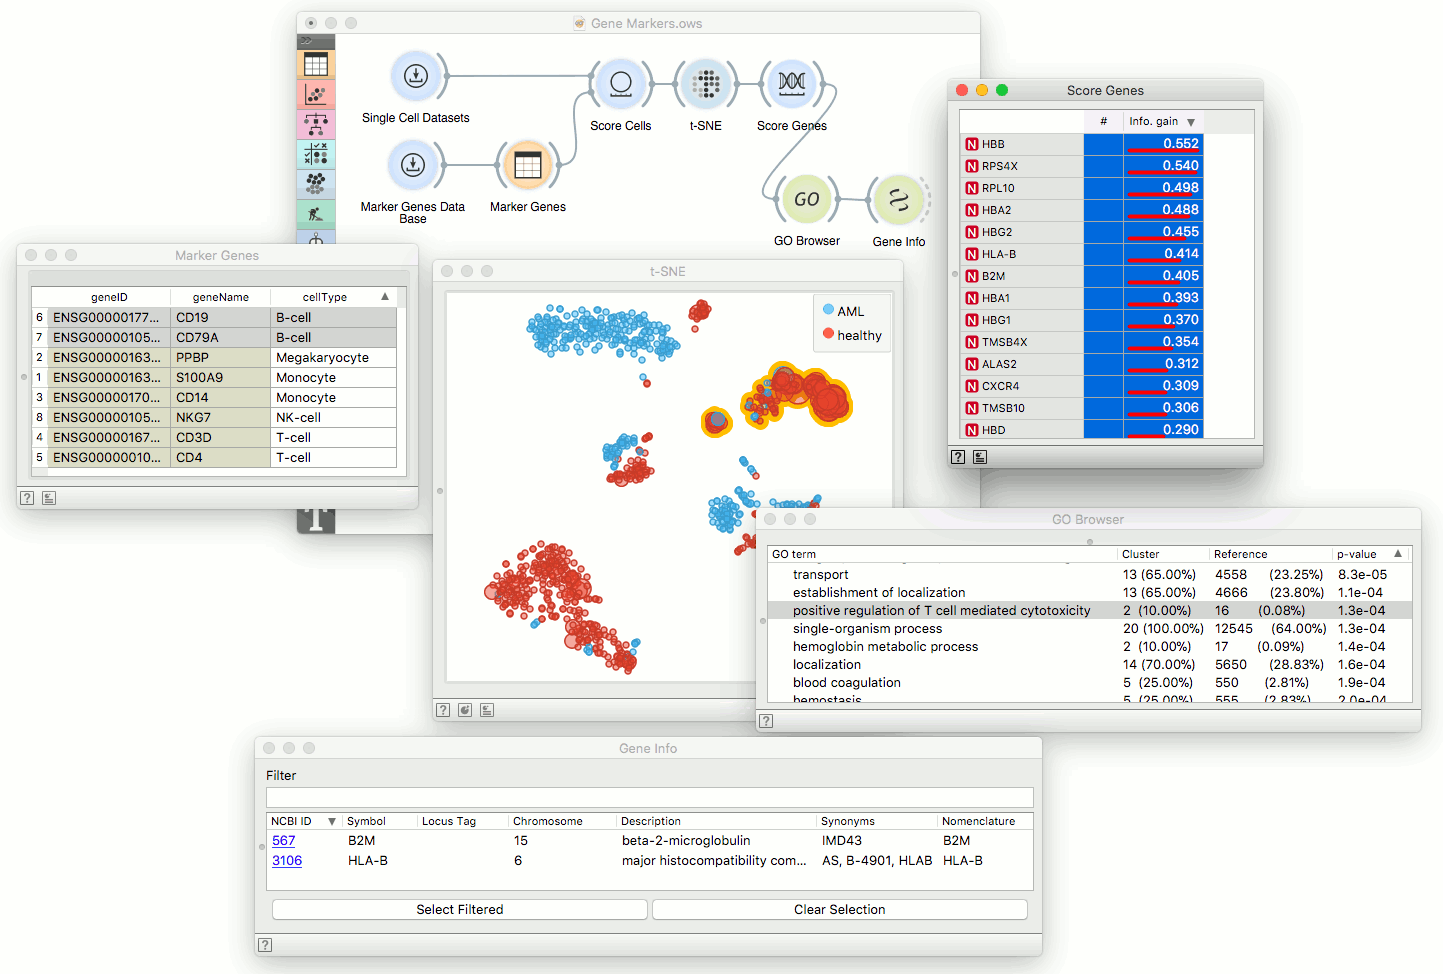
 There's more. In Orange, everything is interactive. Data visualizations, plots of predictive models, data tables, dendrograms... Suppose we are looking for new marker genes. The following workflow marks the cells in t-SNE projection with the overexpressed set of known marker genes for B-cells. Then we select the cluster of the cells surrounding the marked cells (upper right part of the t-SNE projection), and request Score Genes widget to find the genes that define the cluster (genes HBB, RPS4X and others). We select twenty most informative genes, check their enrichment in Gene Ontology and inspect which are the two genes that regulate T cell-mediated cytotoxicity (they are B2M and HLA-B).
 Workflows in Orange consist of widget that read, process and transmit data or information. Most widgets are interactive. They allow for the user to focus on what is essential and exciting, and support explorative data analysis. BioPharm.Si focuses on process data that for privacy reasons did not show here, but it also specializes in the development of data analytics tools of which Orange's toolbox for single-cell genomics is a prime example.
Iskanje
Zadnje
- Workshop on "High Content Imaging and Data Science for Virtual Screening and Drug Discovery"
- VIS-NIR Low-cost Raman spectrometer
- Continuous bioprocess of bacteria and bacteriophages
- CRISPR/Cas9 tool for Genome Editing
- What researchers do at the Department of Catalysis and Chemical Reaction Engineering